Selecting key flow stage heights + refining center-lines
In this step key flow stage elevation values are selected by analyzing the relationship between flow stage height and modeled wetted area. These flow stage elevations will be the basis for the GCS analysis, and have traditionally been associated with concepts like baseflow, bankfull, or a valley filling flood flow. Next, wetted area centerlines are developed for each chosen key flow stage to account for any changes in active channel sinuosity or path.
Inputs
The detrended DEM, ras_detren.tif
USER INPUT: Max stage height in the output spatial reference frame units
Recall, the output spatial reference frame is defined by the user generated AOI shapefile (Setting up)
The max stage height value can be edited as many times as desired while running the GUI.
Outputs
A folder containing wetted area polygons at 0.1ft / 0.03 m flow stage elevation increments, /wetted_polygons
A folder containing plots designed to assist in the key flow stage selection process, /flow_stage_plots
A plot showing the change in wetted area with increases in flow stage elevation, cumulative_area.png
A plot showing the gain in wetted area with each flow stage elevation increment, pdf_plot.png
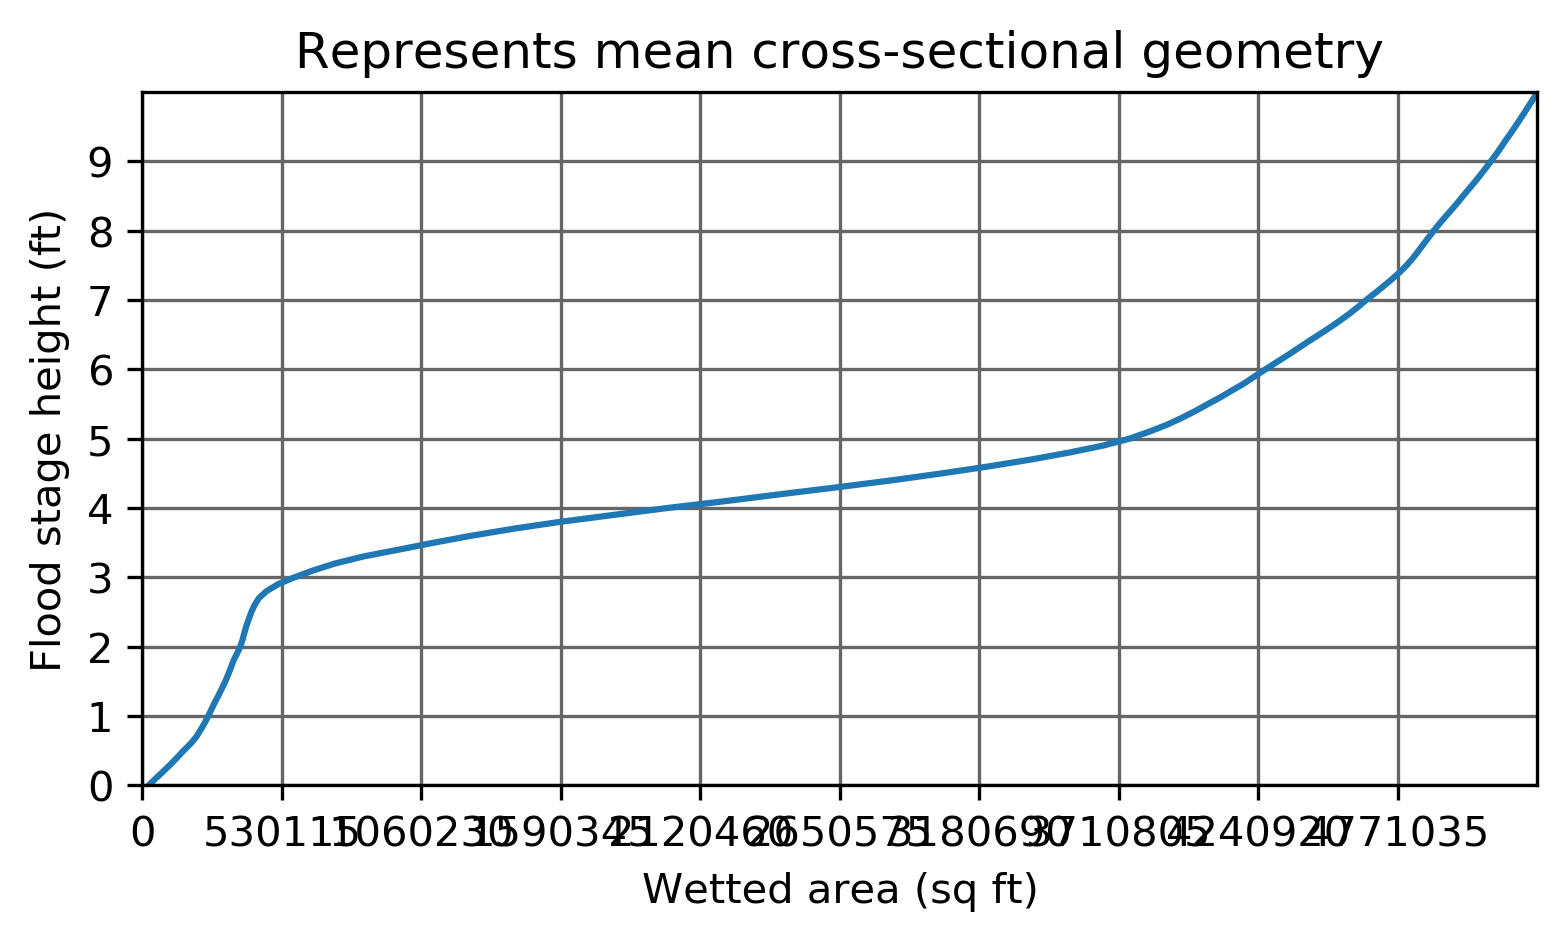
A plot with the same information as the cumulative_area.png, but with axes flipped to represent an idealized river valley cross-sectional geometry, mean_XS_plot.png
Important
Next we select a few flow stage elevations to analyze, which will henceforth be referred to as key flow stages. All analyses going forwards are limited to the key flow stages, therefore they must be carefully selected to generate meaningful results.
Key flow stage selection example
Below we see an example of a detrended DEM, along with it’s thalweg identified in red.
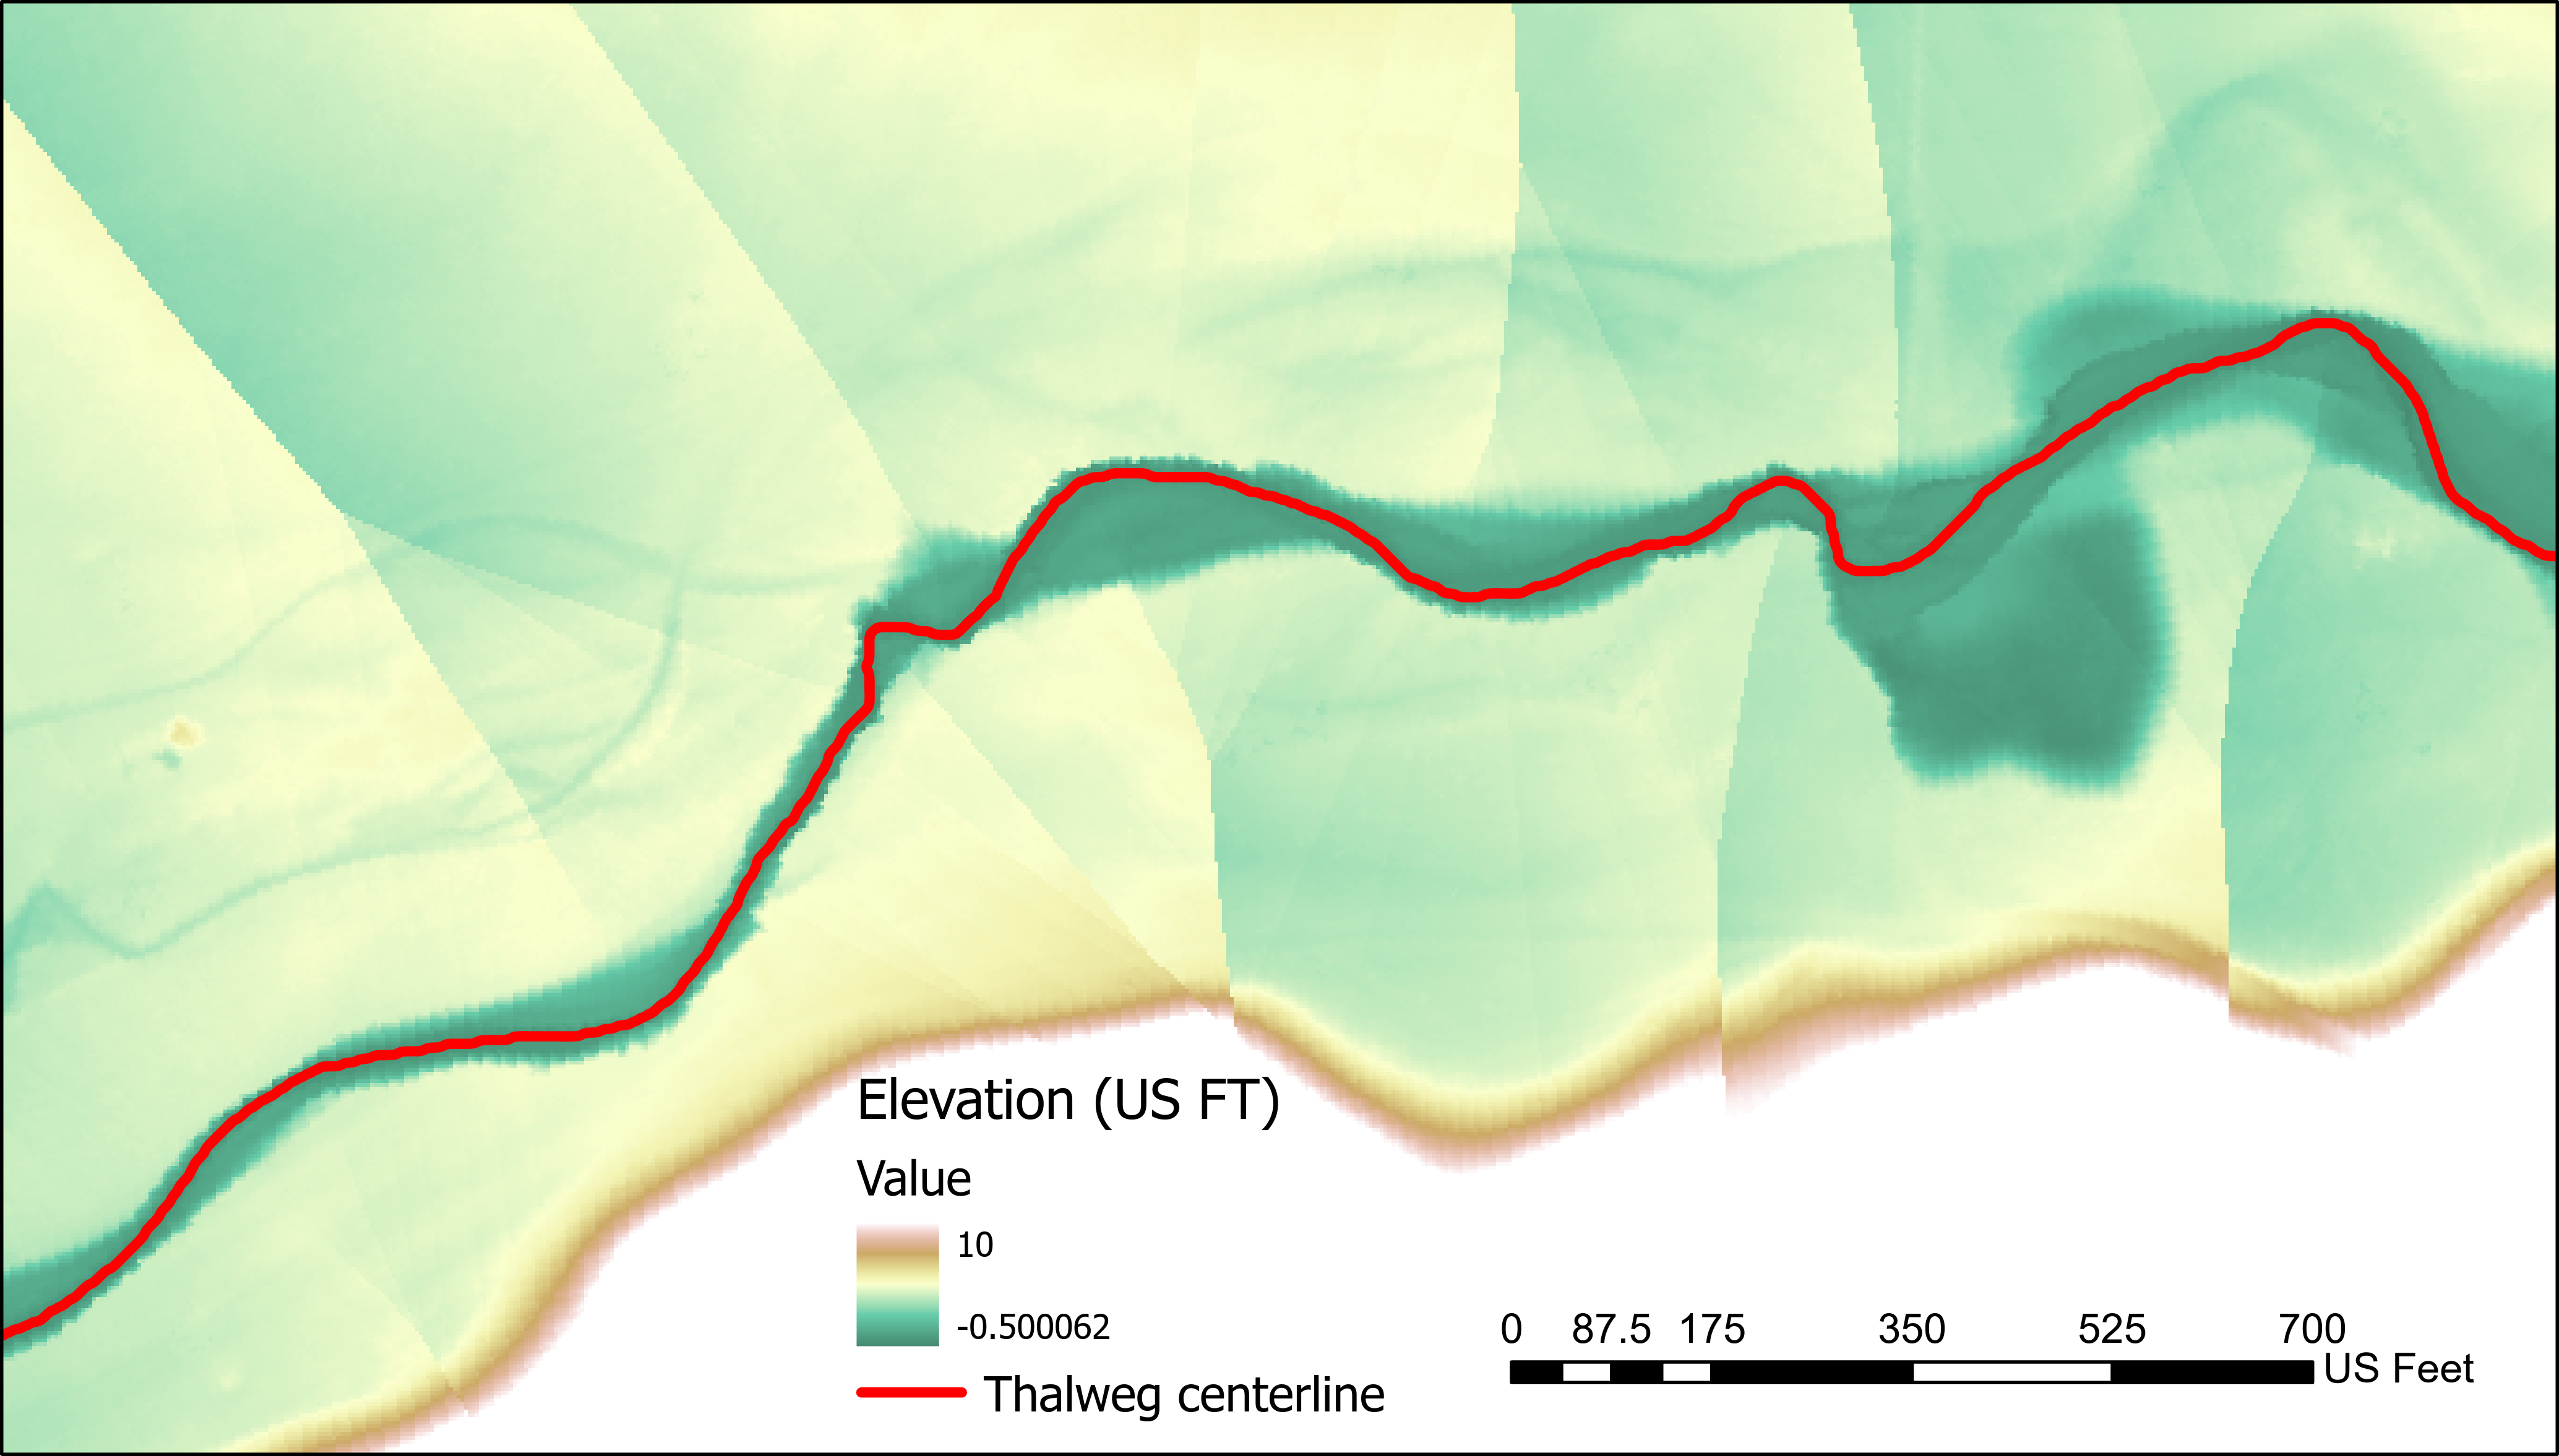
Due to the nature of the flat, wide floodplain we can observe DEM quality issues distal from the channel (see detrending warning), therefore we will select three flow stages of interest that do not inundate the flood plain. Firstly, we choose to reference the pdf_plot.png and cumulative_area.png plots.
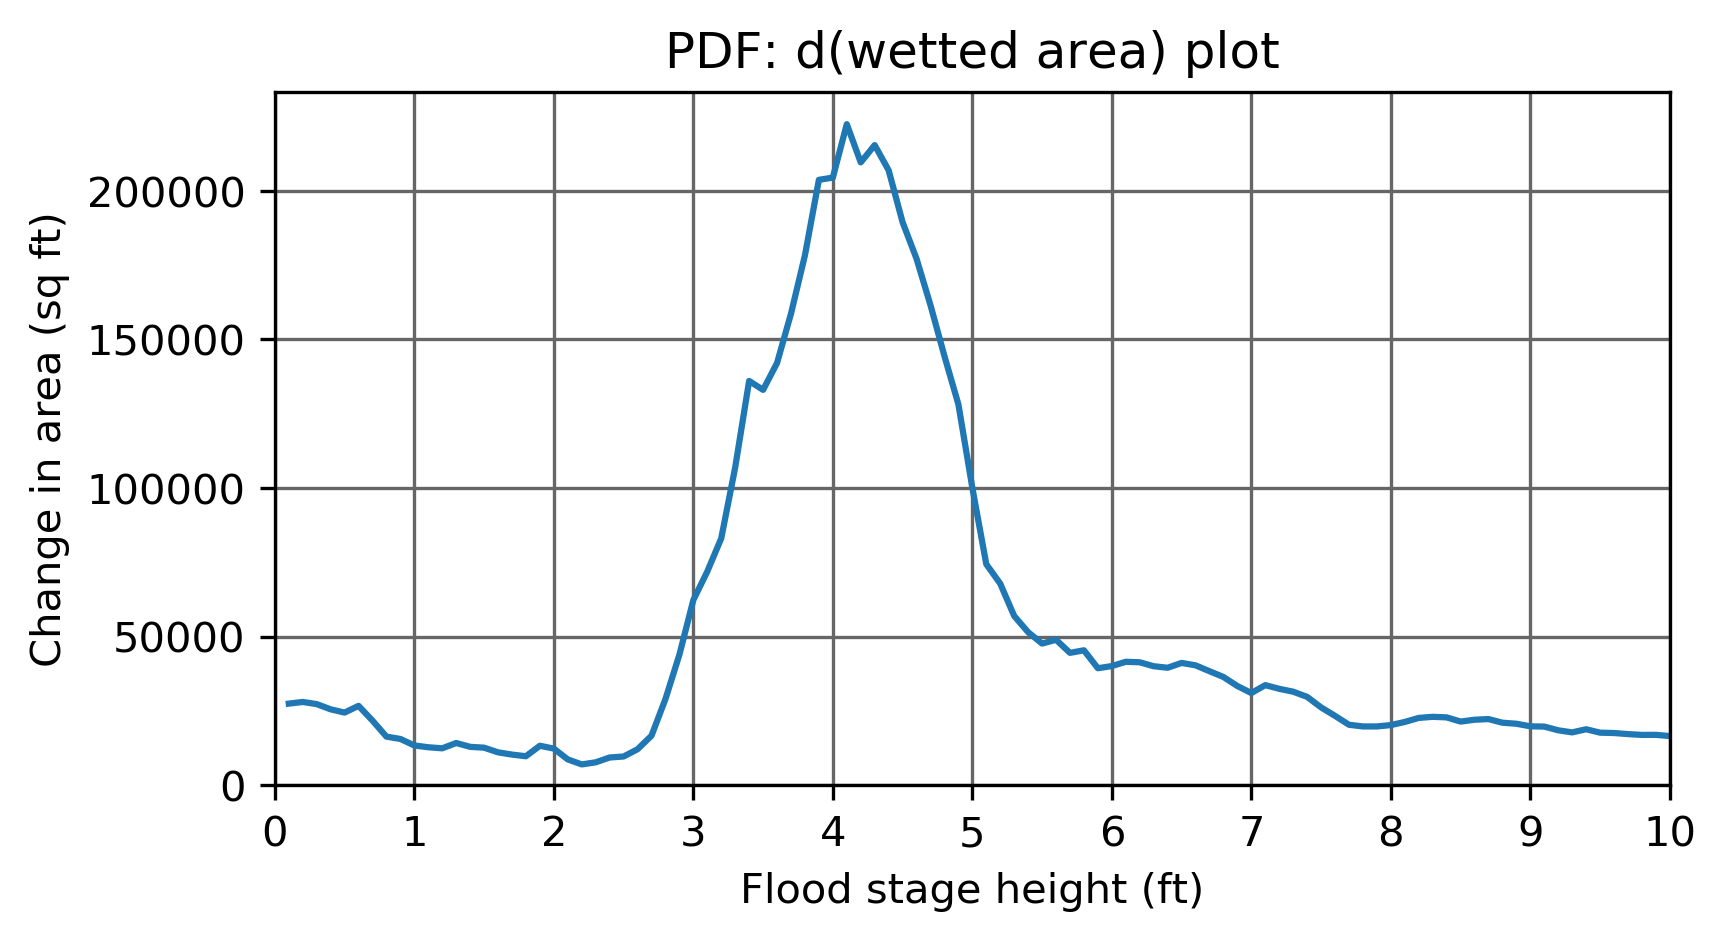
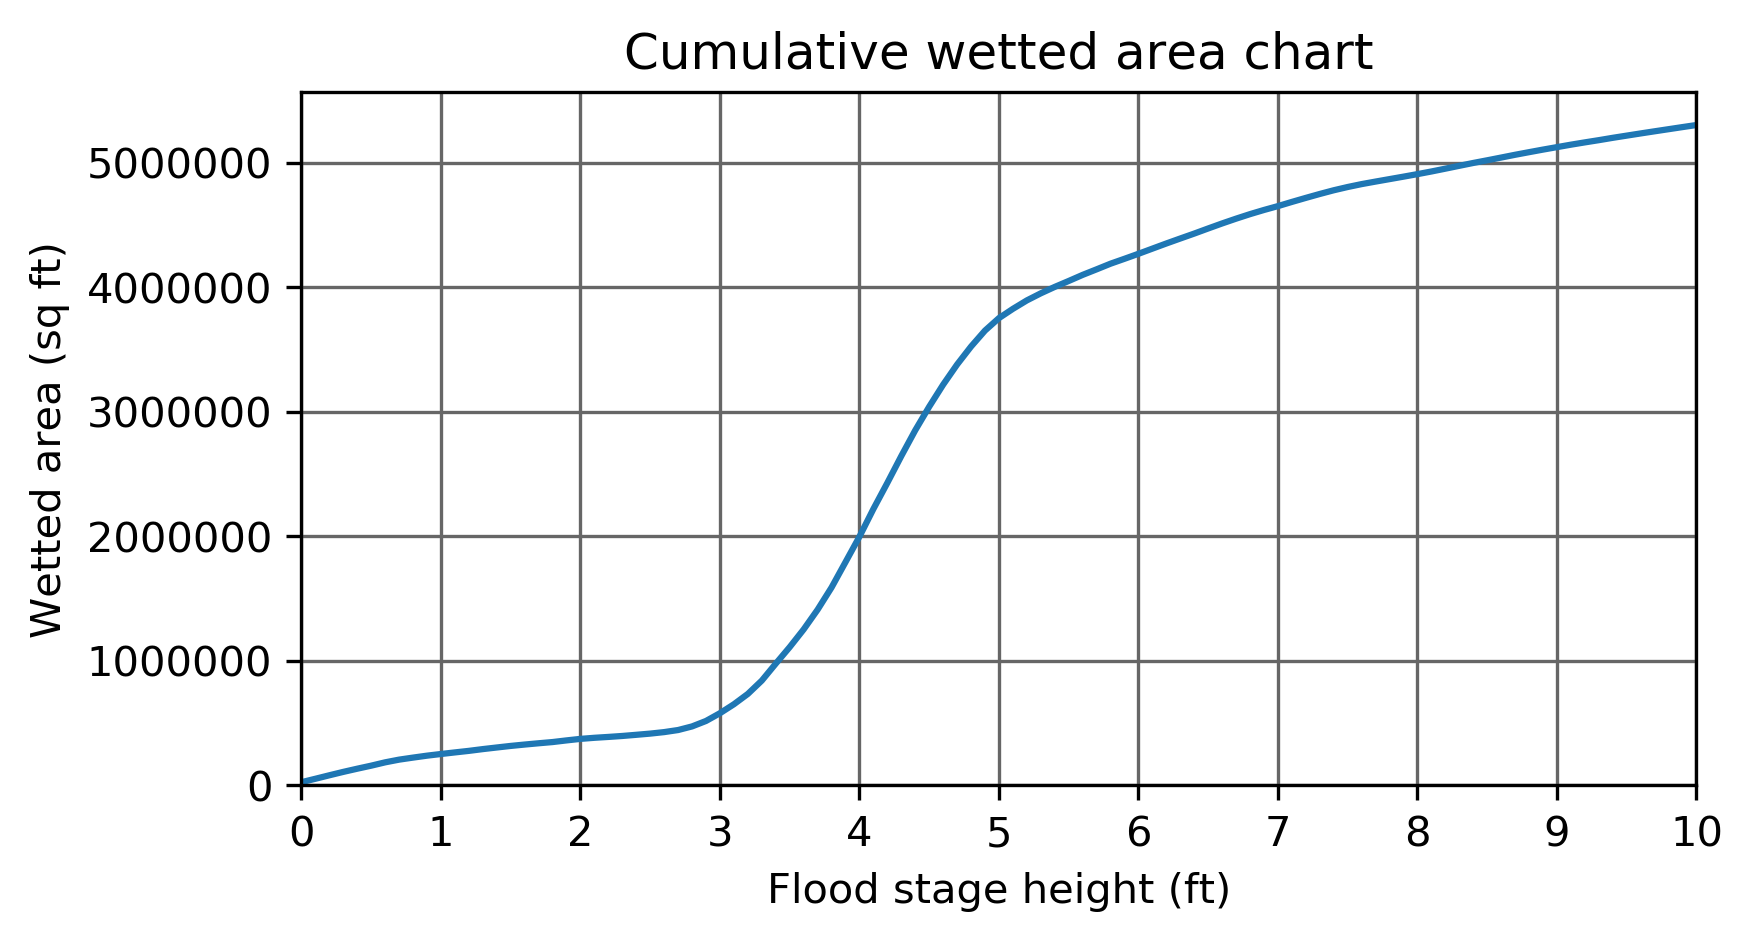
We can notice that at 2.6ft flow stage elevation, there is a transition from relatively low wetted area accumulation to very rapid accumulation. This identifies a topographic threshold at the boundary between channelized and floodplain topography. Therefore, we define 2.6ft as a key flow stage.
Looking at the idealized cross-sectional geometry plot, mean_XS_plot.png, we can see this transition clearly.
Next we look at the detrended DEM itself, along with the wetted area polygons within the output folder, to identify other flow stage elevations of interest. In this example we select 0.2 ft, 0.7 ft, 2.6 ft as our key flow stage elevations.

Above we can see that each of these flow stages inundate different scales of the channelized topography and have discernably different wetted area geometries.
Generating key flow stage centerlines
With key flow stage heights selected, the next step is to produce flow path centerlines for each. The flow path of a river often changes as flow stage increases. This change typically involves a decrease in sinuosity / straightening of the flow. Since GCS analysis aims to sample cross-sections perpendicular to flow, it’s necessary to have flow stage specific centerlines.
Flow stage centerlines are generated in steps:
Make draft centerlines based on simplified wetted area polygons
Manually edit the draft centerlines in ArcPro or ArcMap (see below)
Finalize centerlines by smoothing and prepping for cross-section generation
Making draft centerlines
Input: Enter key flow stage heights separated by commas, ex: ‘0.2,0.7,2.6’
Output: A new sub-folder /centerlines containing draft centerline shapefiles
ex: centerlines/draft_centerline_0p2ft
Stage heights converted to string format: 0.2 ft -> 0p2ft
Editing draft centerlines
Draft centerlines typically suffer from one of a few common issues.
Non-continuous due to gaps in wetted area extent, or other issue wetted area geometry
Floating centerline fragments on non-connected segments of wetted area.
Can occur in low lying areas disconnected from the main flow path of a given flow stage.
Also can occur in braided rivers with complex wetted areas.
Major diversions from flow path due to aspects of wetted area geometry
These common errors should be resolved in ArcPro by manually removing floating fragments, connecting gaps, and fixing erroneous diversions. Refer to the wetted area polygon associated with each centerline to assure that the line remains parallel to flow direction. Do not worry about sharp edges or small diversions, as they are fixed during finalization.
Important
Draft centerlines should be manually edited to ONLY consist of a single, continuous, line formed by line segments meeting end-to-end (no spurs). Flow stage centerlines should be edited to have aligned start/end points! This facilitates analysis of multi-flow-stage nested topography.
Finalize
Running the final centerline button on the GUI will result in a smoothed, dissolved (one segment) centerline file for each key flow stage, centerlines/enterline_0p2ft
Applied method flow chart

Draft centerline editing examples
Below is an example of a draft centerline issue.

To repair such an issue, the line segment on the right of the gap was trimmed, and a new line segment was drawn to connect the lines end to end.

Below we have an example of non-aligned centerline ends, as well as another centerline gap.

Centerline ends must be aligned relative to flow path (i.e. same cross-section), and don’t necessarily have to end at the same point. Below we see an example of properly aligned centerline ends.

Here we have an example of edited draft centerlines that are ready to be finalized! They are continuous, start and end at the same cross-section, and represent each flow stage’s flow direction well.
